About Me!

This blog is about my musings and thoughts. I hope you find it useful, at most, and entertaining, at least.
Other Pages
Presence Elsewhere
Government Spending by Party
Date: 2013-10-02
Tags: government spending
I got into an argument where the other person claimed that the “Democrats vastly outspend the Republicans” and they had no data to back it up. I wanted data; I wanted an answer to this question.
I found historical budget information from the White House site (it’s still up, surprise…that’s a topic for another post). All values are adjusted to FY2005 USD and in millions.
I found historical make ups of the congress from InfoPlease. I then converted the numbers into a ratio of Democrats to Republicans. I ignored third-parties they don’t change the analysis (again, a topic for another post).
I focus on data from 1961 onward as this takes out out of the WWI, Great Depression, and WWII. Also, starting here removes issues regarding names and ideologies not meshing with their current mappings.
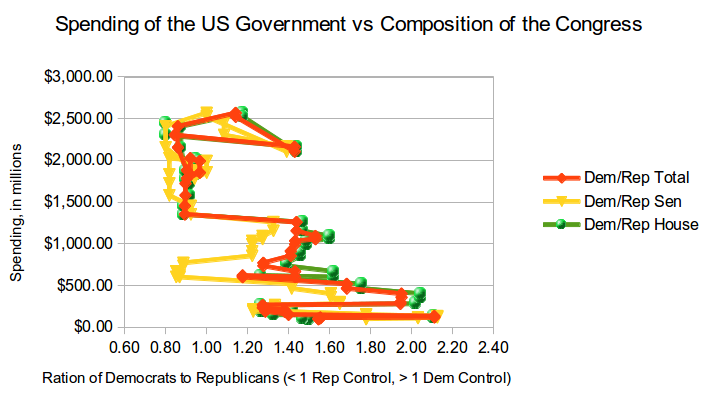
The quick version: On average Republican-controlled Congresses spend $1,912.81 (million) and Democrat-controlled Congresses spend $690.43 (million). The more detailed picture is, as it usually is, more complex where more recently both parties are spending at record levels. The following picture shows spending on the Y-axis in millions and the X-axis is the ratio of Democrats to Republicans (< 1 is Republican Controlled, > 1 is Democrat controlled).
This analysis doesn’t claim either party is better or worse than the other. It doesn’t take into account any historical trends (besides inflation, which is controlled for). A more detailed analysis might try to better account for composition (I simply looked for 50+% control).
I am making the spreadsheet I used for analysis available in OpenDocument format (government-spending.ods), or, if you must, an Excel document (government-spending.xls)