About Me!

This blog is about my musings and thoughts. I hope you find it useful, at most, and entertaining, at least.
Other Pages
Presence Elsewhere
Interpolating Old Census Data
Date: 2016-03-15
Tags: census postgis postgres gis
Problem
A group I’m part of is trying to learn about racial displacement around Pittsburgh. To do so we looked at the census data. We quickly learned that the census geometries (e.g. blocks and tracts) aren’t static between censuses.
While this isn’t entirely surprising, it does complicate the matter of comparing the demographics of blocks and tracts, making it more difficult to compute the overlaps easily.
I was looking at the Longitudinal Tract Database and clicked maps and didn’t like the terms there. (I later found that the LTDB has a separate download section but I couldn’t find the terms of use there. Also, while I can appreciate SPSS being very common it upsets me to see people continuing to distribute data in non-free formats. Thanks be for PSPP !
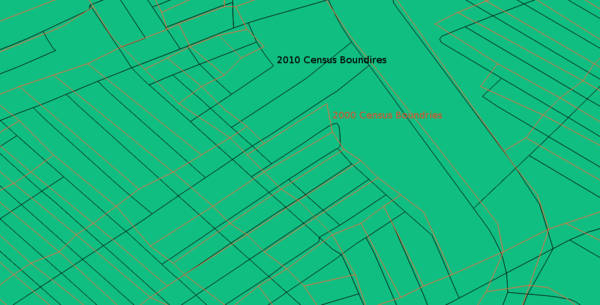
Regardless, I couldn’t find terms of use and many of their menus don’t work, so I decided to figure this out on my own. Looking further into the issue, I found that the census publishes a series of Relationship Files that contains which geometries were merged and split between 2000 and 2010. Moreover, it contains the area of each AND the area of the intersection between them. (The intersection part is important, because as can be seen in the image over, the geometries don’t align properly and the 2000 geometries are “rougher” than the 2010 ones anyway. So It would be much more difficult to do the intersection area based on the published geometries.)
Solution
Having the intersection areas allows us to do “areal interpolation.” I used a simple method of $$ attribute_{target} = attribute_{source} * \frac {area_{intersection}}{area_{source}} $$. Since each geometries is only overlapping at most a handful of immediately adjacent ones, and often with 10% or more of its total area, I felt this simpler method was warranted.
Now on to the creation of the interpolation layers. First we need census data to interpolate. I’m in Pennsylvania, so we’ll focus on it. I was also specifically focusing on Race, which means all my examples are for Census 2010 Table P3 and Census 2000 Table P7
Importing the Census 2000 Summary Files
wget -x -c -m -r -np http://www2.census.gov/census_2000/datasets/Summary_File_1/Pennsylvania/ will pull all the tables for Summary File 1 which is unsampled data. (Summary File 3 is a 1-in-6 sample and contains information that was later moved into the ACS .)
I then gathered the schema for the 2000 Census from various files such as the MS Access Shell and SAS Programs. (There is a Free Software readers for MS Access called MDB Tools [Warning: SourceForge Link]. Dap is an application that can read SAS files and do much of what SAS can. For my purposes, I was able to get what I needed directly from the SAS program file itself.)
I’ve been using PostgreSQL, but you should be able to modify the queries if you choose to use another RDBMS.
For the sake of time, I created a schema file (it contains all tables, but not all indecies a full import would want) and an import query for the geoheader. Remember to import the sf1geo file into the census2000.tmp_geoheader first and then run the import query. I find it easier to work in fips ids, so I create them, as can be seen as te last line in the import query.
The census data files, once unziped, can be imported via a COPY command (\copy in psql), e.g. \copy census2000.sf10001 from "/mnt/tmp/www2.census.gov/census_2000/datasets/Summary_File_1/Pennsylvania/pa00001.uf1"
Importing the 2010 Census data is similar. I’ll dedicate another post to the details of the census and ACS imports.
I wasn’t able to find broken out views or human-readable-field-name views, so I’m working on find a file similar to the 2010 field id to name mapping put out by the census. Alternatively, I might attempt to extract that information from the text of the SF1 Technical Document or from FactFinder . Either way, that’s for another blog post!
Create Interpolations
Relationship Files
I then grabbed the Relationship File for the blocks, created this schema and used a COPY command to import the file. From there I ran a query to update the conversion factors (to make later queries simpler).
update public.tabblock_00_10 set c10_00 = case when arealand_2010 = 0 then 0 else arealand_int::double precision / arealand_2010::double precision end,
                                 c00_10 = case when arealand_2000 = 0 then 0 else arealand_int::double precision / arealand_2000::double precision end;
Interpolate!
First I began by doing the interpolation at the following summary levels [PDF] (HTML table without the block level code):
| Summary Level | Description |
|---|---|
| 101 | Block Level (State-County-County Subdivision-Place/Remainder-Census Tract-Block Group-Block) |
| 140 | State-County-Census Tract |
| 050 | State-County |
| 040 | State |
create  table c00p7proj2010 as
  select

    state_2010 as state, county_2010 as county, tract_2010 as tract, blk_2010 as block, concat(state_2010, county_2010, tract_2010, blk_2010) as geoid10,
    sum(P007001 * c00_10) AS Total_population,
    sum(P007002 * c00_10) AS White_alone,
    sum(P007003 * c00_10) AS Black_or_African_American_alone,
    sum(P007004 * c00_10) AS American_Indian_and_Alaska_Native_alone,
    sum(P007005 * c00_10) AS Asian_alone,
    sum(P007006 * c00_10) AS Native_Hawaiian_and_Other_Pacific_Islander_alone,
    sum(P007007 * c00_10) AS Some_Other_Race_alone,
    sum(P007008 * c00_10) AS Two_or_More_Races

  from census2000.sf10002
  inner join census2000.sf1geo using (logrecno)
  inner join tabblock_00_10 using (geoid00)
  where sumlev in (‘101’)
  group by rollup(state_2010, county_2010, tract_2010, blk_2010);
The table c00p7proj2010 now contains the Census 2000 counts interpolated into the Census 2010 blocks. Now I wanted to compute the values for geometries higher in the hierarchy [PDF] made up of the blocks we just computed. “Why not just interpolate each individually?” you may be asking. The reason is that if a tract were split in such a way that an area of low population (e.g. a park) was made its own tract or moved to a different tract, the interpolation would move people who never lived there to the other tract. By performing the interpolation at the smalled possible geometry, this issue is largely avoided as areas of low population are their own block, not incorporated into others.
create table c00p7proj2010_rollup as
  select

    state, county, tract, block, concat(state, county, tract, block) as geoid10,
    sum(Total_population) AS Total_population,
    sum(White_alone) AS White_alone,
    sum(Black_or_African_American_alone) AS Black_or_African_American_alone,
    sum(American_Indian_and_Alaska_Native_alone) AS American_Indian_and_Alaska_Native_alone,
    sum(Asian_alone) AS Asian_alone,
    sum(Native_Hawaiian_and_Other_Pacific_Islander_alone) AS Native_Hawaiian_and_Other_Pacific_Islander_alone,
    sum(Some_Other_Race_alone) AS Some_Other_Race_alone,
    sum(Two_or_More_Races) AS Two_or_More_Races

  from c00p7proj2010

  group by rollup(state, county, tract, block);
In order to deal with the tables that are the same name, we’re going to tease out the fields we want from the 2010 Census.
create table c10p3 as
  select

    state, county, tract, block, geoid10,
    P0030001 AS Total_population,
    P0030002 AS White_alone,
    P0030003 AS Black_or_African_American_alone,
    P0030004 AS American_Indian_and_Alaska_Native_alone,
    P0030005 AS Asian_alone,
    P0030006 AS Native_Hawaiian_and_Other_Pacific_Islander_alone,
    P0030007 AS Some_Other_Race_alone,
    P0030008 AS Two_or_More_Races

  from census2010.sf1_00003
  inner join census2010.geo_header_sf1 using (logrecno)
  where
  sumlev in (‘101’, ‘140’, ‘050’, ‘040’);
Now we want to compute the percent each group makes of the total population.
create table c10p3_percent as select geoid10, Total_population, Total_population::double precision / Total_population::double precision AS Total_population_percent, White_alone, White_alone / Total_population::double precision AS White_alone_percent, Black_or_African_American_alone, Black_or_African_American_alone / Total_population::double precision AS Black_or_African_American_alone_percent, American_Indian_and_Alaska_Native_alone, American_Indian_and_Alaska_Native_alone / Total_population::double precision AS American_Indian_and_Alaska_Native_alone_percent, Asian_alone, Asian_alone / Total_population::double precision AS Asian_alone_percent, Native_Hawaiian_and_Other_Pacific_Islander_alone, Native_Hawaiian_and_Other_Pacific_Islander_alone / Total_population::double precision AS Native_Hawaiian_and_Other_Pacific_Islander_alone_percent, Some_Other_Race_alone, Some_Other_Race_alone / Total_population::double precision AS Some_Other_Race_alone_percent, Two_or_More_Races, Two_or_More_Races / Total_population::double precision AS Two_or_More_Races_percent from c10p3 where Total_population::double precision > 0 ;create table c00p7proj2010_percent as select
geoid10, Total_population, Total_population / Total_population AS Total_population_percent, White_alone, White_alone / Total_population AS White_alone_percent, Black_or_African_American_alone, Black_or_African_American_alone / Total_population AS Black_or_African_American_alone_percent, American_Indian_and_Alaska_Native_alone, American_Indian_and_Alaska_Native_alone / Total_population AS American_Indian_and_Alaska_Native_alone_percent, Asian_alone, Asian_alone / Total_population AS Asian_alone_percent, Native_Hawaiian_and_Other_Pacific_Islander_alone, Native_Hawaiian_and_Other_Pacific_Islander_alone / Total_population AS Native_Hawaiian_and_Other_Pacific_Islander_alone_percent, Some_Other_Race_alone, Some_Other_Race_alone / Total_population AS Some_Other_Race_alone_percent, Two_or_More_Races, Two_or_More_Races / Total_population AS Two_or_More_Races_percent from c00p7proj2010 where Total_population > 0;
Finally, we create a table that contains the absolute differences in population along with the difference in percentage (as percentage points, i.e. not a ratio).
create table diff_00p10_10_00p7_10p3 as
  select

    geoid10,
    c10p3.Total_population AS c10p3_Total_population,
    c00p7.Total_population AS c00p7_Total_population,
    c10p3.Total_population-c00p7.Total_population AS diff_Total_population,
    c10p3.Total_population_percent AS c10p3_Total_population_percent,
    c00p7.Total_population_percent AS c00p7_Total_population_percent,
    c10p3.Total_population_percent-c00p7.Total_population_percent AS diff_Total_population_percent,
    c10p3.White_alone AS c10p3_White_alone,
    c00p7.White_alone AS c00p7_White_alone,
    c10p3.White_alone-c00p7.White_alone AS diff_White_alone,
    c10p3.White_alone_percent AS c10p3_White_alone_percent,
    c00p7.White_alone_percent AS c00p7_White_alone_percent,
    c10p3.White_alone_percent-c00p7.White_alone_percent AS diff_White_alone_percent,
    c10p3.Black_or_African_American_alone AS c10p3_Black_or_African_American_alone,
    c00p7.Black_or_African_American_alone AS c00p7_Black_or_African_American_alone,
    c10p3.Black_or_African_American_alone-c00p7.Black_or_African_American_alone AS diff_Black_or_African_American_alone,
    c10p3.Black_or_African_American_alone_percent AS c10p3_Black_or_African_American_alone_percent,
    c00p7.Black_or_African_American_alone_percent AS c00p7_Black_or_African_American_alone_percent,
    c10p3.Black_or_African_American_alone_percent-c00p7.Black_or_African_American_alone_percent AS diff_Black_or_African_American_alone_percent,
    c10p3.American_Indian_and_Alaska_Native_alone AS c10p3_American_Indian_and_Alaska_Native_alone,
    c00p7.American_Indian_and_Alaska_Native_alone AS c00p7_American_Indian_and_Alaska_Native_alone,
    c10p3.American_Indian_and_Alaska_Native_alone-c00p7.American_Indian_and_Alaska_Native_alone AS diff_American_Indian_and_Alaska_Native_alone,
    c10p3.American_Indian_and_Alaska_Native_alone_percent AS c10p3_American_Indian_and_Alaska_Native_alone_percent,
    c00p7.American_Indian_and_Alaska_Native_alone_percent AS c00p7_American_Indian_and_Alaska_Native_alone_percent,
    c10p3.American_Indian_and_Alaska_Native_alone_percent-c00p7.American_Indian_and_Alaska_Native_alone_percent AS diff_American_Indian_and_Alaska_Native_alone_percent,
    c10p3.Asian_alone AS c10p3_Asian_alone,
    c00p7.Asian_alone AS c00p7_Asian_alone,
    c10p3.Asian_alone-c00p7.Asian_alone AS diff_Asian_alone,
    c10p3.Asian_alone_percent AS c10p3_Asian_alone_percent,
    c00p7.Asian_alone_percent AS c00p7_Asian_alone_percent,
    c10p3.Asian_alone_percent-c00p7.Asian_alone_percent AS diff_Asian_alone_percent,
    c10p3.Native_Hawaiian_and_Other_Pacific_Islander_alone AS c10p3_Native_Hawaiian_and_Other_Pacific_Islander_alone,
    c00p7.Native_Hawaiian_and_Other_Pacific_Islander_alone AS c00p7_Native_Hawaiian_and_Other_Pacific_Islander_alone,
    c10p3.Native_Hawaiian_and_Other_Pacific_Islander_alone-c00p7.Native_Hawaiian_and_Other_Pacific_Islander_alone AS diff_Native_Hawaiian_and_Other_Pacific_Islander_alone,
    c10p3.Native_Hawaiian_and_Other_Pacific_Islander_alone_percent AS c10p3_Native_Hawaiian_and_Other_Pacific_Islander_alone_percent,
    c00p7.Native_Hawaiian_and_Other_Pacific_Islander_alone_percent AS c00p7_Native_Hawaiian_and_Other_Pacific_Islander_alone_percent,
    c10p3.Native_Hawaiian_and_Other_Pacific_Islander_alone_percent-c00p7.Native_Hawaiian_and_Other_Pacific_Islander_alone_percent AS diff_Native_Hawaiian_and_Other_Pacific_Islander_alone_percent,
    c10p3.Some_Other_Race_alone AS c10p3_Some_Other_Race_alone,
    c00p7.Some_Other_Race_alone AS c00p7_Some_Other_Race_alone,
    c10p3.Some_Other_Race_alone-c00p7.Some_Other_Race_alone AS diff_Some_Other_Race_alone,
    c10p3.Some_Other_Race_alone_percent AS c10p3_Some_Other_Race_alone_percent,
    c00p7.Some_Other_Race_alone_percent AS c00p7_Some_Other_Race_alone_percent,
    c10p3.Some_Other_Race_alone_percent-c00p7.Some_Other_Race_alone_percent AS diff_Some_Other_Race_alone_percent,
    c10p3.Two_or_More_Races AS c10p3_Two_or_More_Races,
    c00p7.Two_or_More_Races AS c00p7_Two_or_More_Races,
    c10p3.Two_or_More_Races-c00p7.Two_or_More_Races AS diff_Two_or_More_Races

  from c10p3_percent as c10p3
  inner join c00p7proj2010_percent as c00p7 using (geoid10);
In order to display the values on a map, we need to join the values with the Census 2010 Tiger geometries.
create or replace view blk_00p10_10_00p7_10p3_geom as select * from diff_00p10_10_00p7_10p3 inner join tiger2010.tabblock using (geoid10);
create or replace view tract_00p10_10_00p7_10p3_geom as select * from diff_00p10_10_00p7_10p3 inner join tiger2010.tract using (geoid10);